
Andreas Fertner
Oct 8, 2021
A new way of collecting enterprise data

If you have worked in corporate environments, it's very likely you were involved in data collection processes, in one way or another.
I'm sure you've experienced Excel templates being sent to colleagues, subsidiaries or other departments in order to get information necessary for making business decisions. And maybe you've also seen Planning and Consolidation tools being used to collect data.
Both methods have disadvantages.
| MS Excel | Financial planning & consolidation solutions |
|---|---|
| time intensive | expensive to acquire and manage |
| error-prone | complicated to learn and manage |
So is there something in-between Excel and Consolidation systems that doesn't have those disadvantages?
Until now, to our knowledge, there was not.
We think colea is the solution, that doesn't have mentioned disadvantages.
Let's discuss how colea avoids these problems by describing some of its core features.
Reporting units
In colea data is collected per reporting unit. A reporting unit can be of different types. The table below shows some examples.
| Type | Number of responsible users | Examples |
|---|---|---|
| Colleague | 1 | Jessica King, James Price, Mason Morris etc. |
| Department | >1 | Finance, IT, Treasury, Procurement, Sales, Marketing etc. |
| Subsidiary | >1 | T2S Insurance Limited, T2S Bank Limited, T2S Austria Limited etc. |
| Country | >1 | Austria, Germany, United Kingdom, United States, Switzerland etc. |
The users who are able to submit data for specific reporting units, can be configured. For example, you might want 3 users to be able to submit data for the country United States (the CFO, the Controller and the Accountant). This means that in case the Controller, who may be the person mainly responsible for submitting data, is not available, the CFO or the Accountant takes over and submits the data.
Automatic consolidation
As described, data is collected per reporting unit. As a consequence, these reporting units need to be accessible in a consolidated format.
Data collected via colea is available in a consolidated way instantly when data is entered by users. This data can be consumed in the following ways:
- Via the colea web interface
- Via Excel/.csv Export
- Via OData (MS Excel, Tableau and other tools support that interface). That means a direct connection between MS Excel and colea can be established so that data from colea can be displayed in an Excel table. Using the MS Excel refresh function data can be reloaded from colea.
- Via GraphQL
- Via Snowflake (data can be pushed to Snowflake)
Submission Status
Data entered by users is instantly saved and made available to the collection administrator. However, in order to make the collection administrator know that the entries made by the user(s) are final, the submission function comes into play.
With the click of a button (Submit button), data is submitted and therefore cannot be changed anymore by the user.
The administrator sees the submission in the submission dashboard.
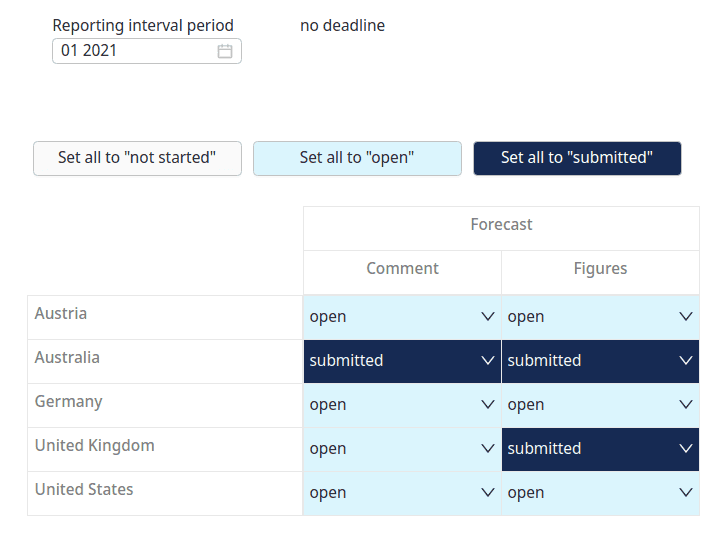
In the example shown in the image, you can see that Australia has submitted all information and United Kingdom only the "Figures" widget. "Comment" and "Figures" both represent different widgets that need to be filled out by the users. The submissions shown are for the period January 2021.
Of course, the collection administrator(s) can change the status back to "open" in case corrections or changes are necessary.
Reporting interval
Each data collection has a reporting interval. That means that when configuring a collection, you have to decide how often the data needs to be reported. The following options are available.
- Daily
- Weekly
- Monthly
- Quarterly
- Yearly
- Only once
Widgets, no database
In planning or consolidation tools, you usually have to configure a database model first and then setup a data entry mask. The consequence is that the process of getting to a finished data collection process is cumbersome, complex and expensive.
In colea, we eliminated the database model configuration part.
Therefore, when you setup a collection, you configure the data entry mask. That's it.
In order to do so, colea uses Widgets.

Using drag & drop, widgets can be put on a canvas. For example, when using the Matrix widget, a data entry mask may look as follows.
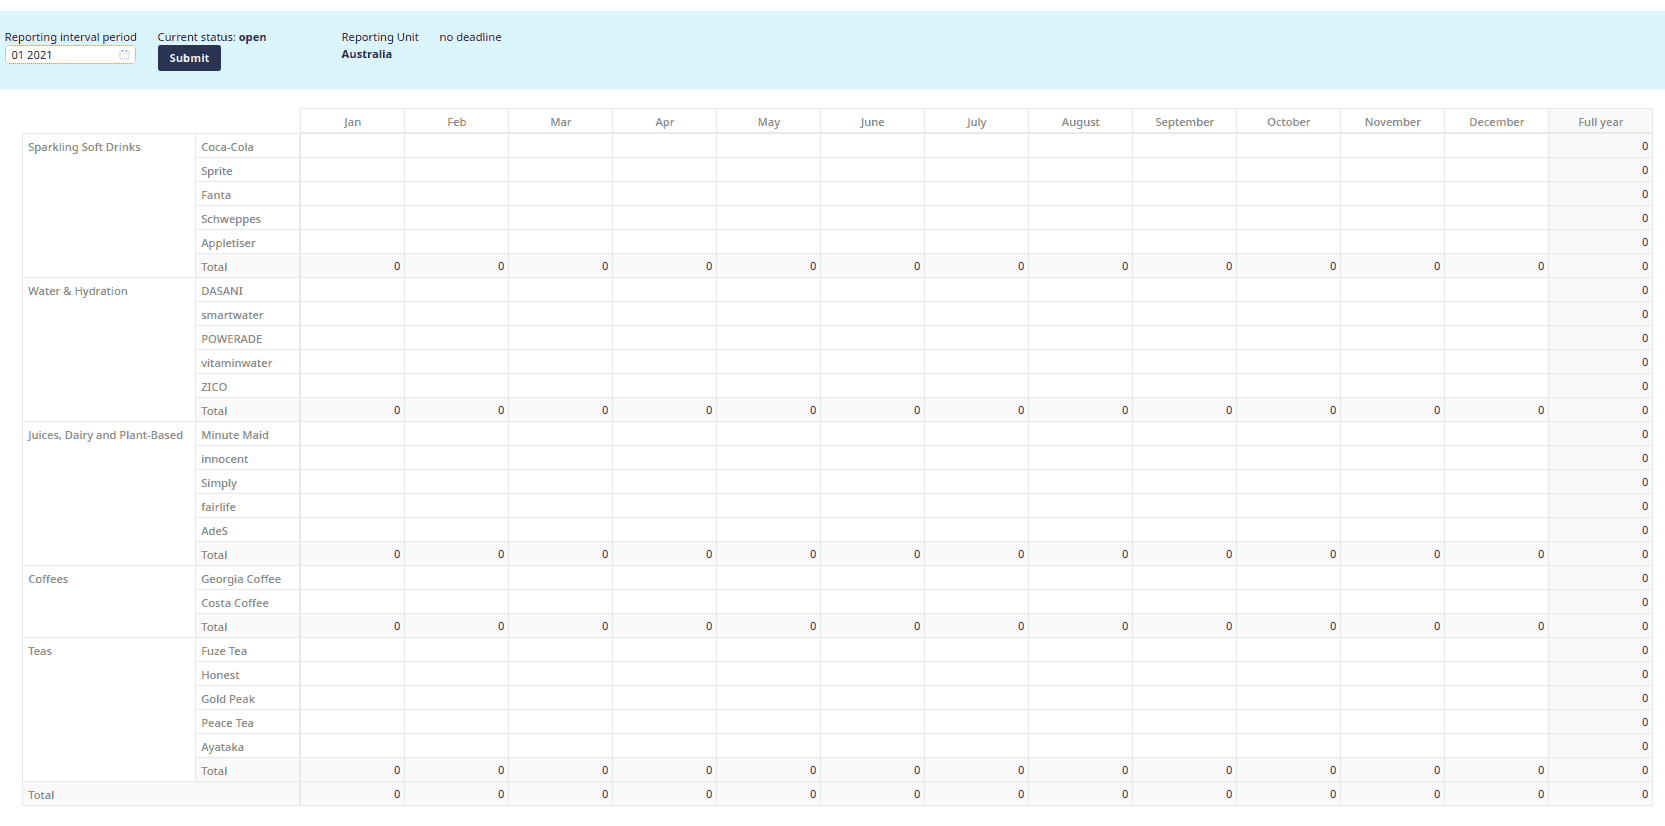
Of course multiple widgets can be placed on a canvas as well. Furthermore, multiple pages can be used.
Multidimensional data entry masks
When you want users to fill out an entire Excel template for each product or for each customer, you usually use different sheets. In colea you can take advantage of Point Of View lists.
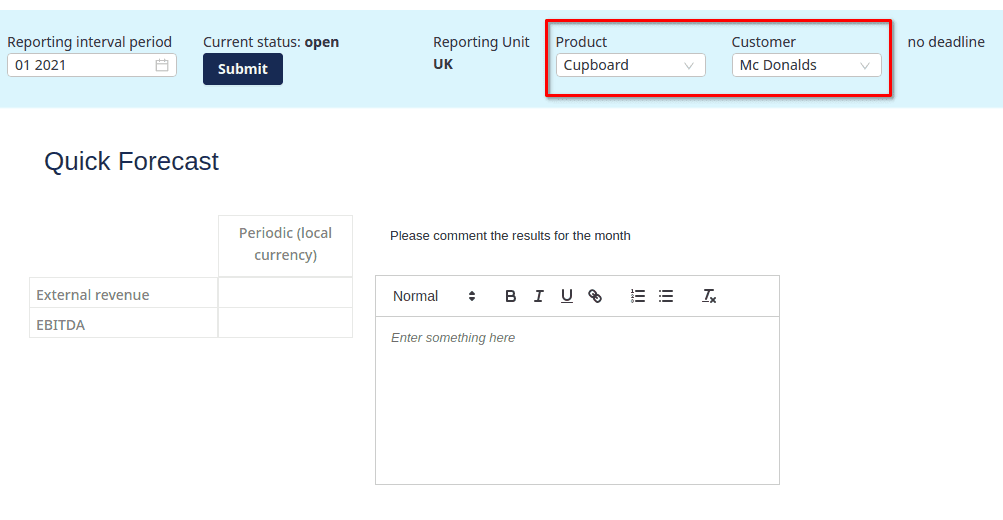
This means that you can define a set of lists that will be shown in the header of the template. Data that is entered in the widgets by users, is then associated to the selection in the header. In the example shown in the screenshot above, the Point Of View combination selected is Cupboard/Mc Donalds.
Designed for business users
colea does not require advanced IT skills. It was designed by Business users for business users. Data entry masks can be configured by following a step by step process.
In our experience it takes a 2 hour training for learning how to build simple data entry masks and 4-8 hours for learning how to build complex data entry masks that take advantage of all features colea provides.
Advanced features
Of course colea offers so much more. Some examples:
-
Deadline setting
-
Automatic reminders
-
Formulas
-
Unique links (users without registration)
-
List combinations (showing one country one set of products and another country another)
-
Multidimensional reporting units
-
Data import
-
Prepopulation
-
Global lists
-
... and many more.


